GENDERACTION data dashbord
27.9.2021
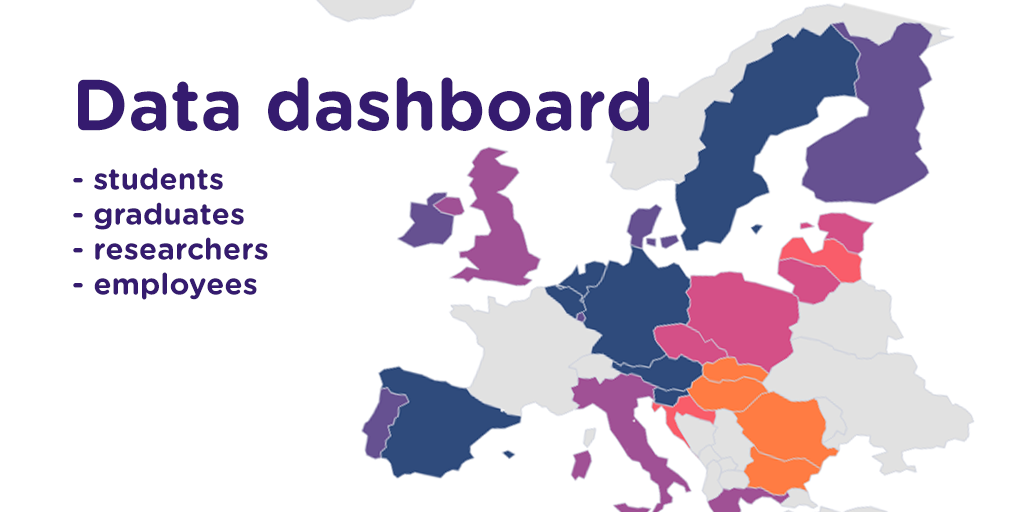
 The dashboard presents various statistics on topics we tackled in the GENDERACTION project, regarding proportions of women in research and policies towards gender equality in R&I. It showcases, for example, the results of WP 3 analyses of NAPs implementation. The dashboard can be accessed via the project website. It offers not only visualizations but also insights into statistics and its meaning. Users are able to interact with the content of the dashboards and may use its components (data or graphs) in their own reports or work, in particular, they will be able to download data (in a CSV or excel format) or graphs (PNG form) presented in the dashboard.


